

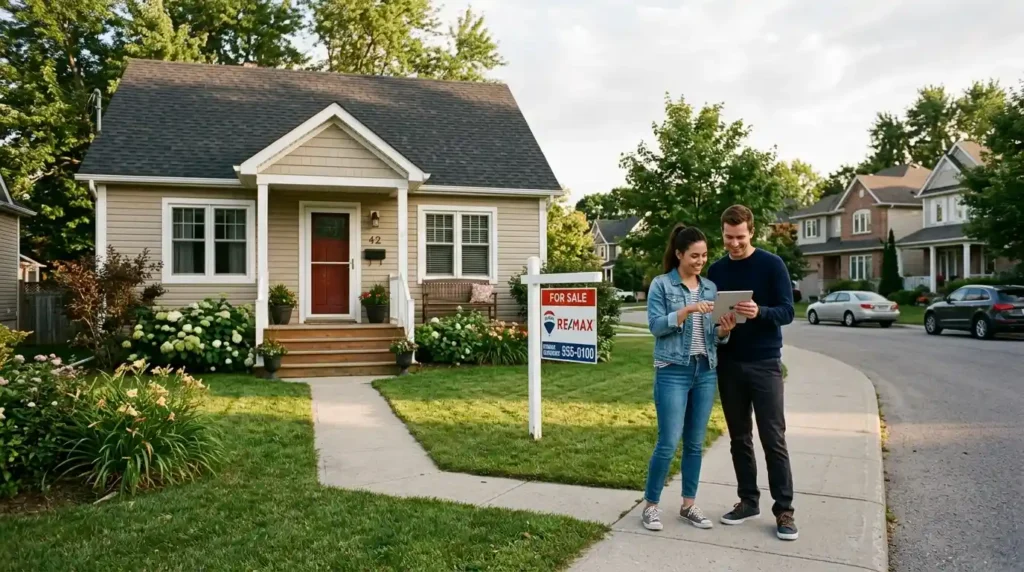
My cousin makes decent money. Not rich. Not struggling either, solidly middle class by any normal measure. She spent this spring trying to buy a house. Kept running into the same wall every time. Every home in her range needed an income closer to six figures than her actual paycheck. Turns out that’s not just her market being weird. Harvard’s Joint Center for Housing Studies ran the numbers on 2025. Median existing single-family home. Nearly five times median household income to buy it. Back in the 1990s that ratio sat at 3.2 times, nowhere close to where it landed now. Middle class homes haven’t gotten smaller. Haven’t gotten fancier either. The math underneath them just broke. This piece walks through why, what it actually costs monthly, and where the numbers still hold up somewhere.
What Counts as a Middle Class Home Right Now?
Definitions shift depending on who’s doing the defining. Most housing researchers land somewhere similar though. Roughly $45,000 to $75,000 a year, that’s the core middle-income band in a lot of federal and industry data. Not poverty-level. Not upper-income either. Just the broad middle most people picture when they hear the phrase. What that income actually buys has shrunk fast, that’s the real problem here. Listings affordable to a household earning $75,000 or less made up 49% of national housing inventory back in 2019. By March 2026, per National Association of Realtors and Realtor.com data cited in Harvard’s report, that share had fallen. Down to just 23%. Less than half of what it used to be. In under a decade.
What household income counts as middle class for home buying?
Somewhere between $45,000 and $75,000 a year. Depends on the source and the metro area you’re actually looking at, honestly. That range gets used as the standard middle-income band across a lot of federal housing programs and industry research. Cost of living shifts the real number a lot though. Middle class in rural Ohio and middle class in coastal California aren’t remotely the same paycheck, not even close, even though both households check the same box on a national survey.
The Math That Stopped Working
A 3.2x price-to-income ratio. That’s roughly what buyers dealt with through most of the 1990s, and it was reasonable. A household earning $75,000 could realistically eye a home in the $240,000 range and make it work without much drama. Nearly 5x now. Same household, same income. Staring at something closer to $375,000 or more just to hit the median. My cousin ran these numbers herself before giving up on her first search, actually did the math on a legal pad like it was 1995. Didn’t come out the same, obviously. Monthly mortgage payments on a median-priced home now run around $2,420, according to Harvard’s analysis. Roughly double what they cost at the end of 2020. Only 16% of renter households currently earn the $120,800 minimum Harvard calculates as necessary to afford that median home. Eighty-four percent locked out by income alone. Before location or credit score even enters the picture.
How much does a median home cost compared to income today?
Nearly five times median household income. Versus 3.2 times through most of the 1990s. That’s the core gap right there, and it’s why so many households who’d have qualified easily a generation ago now get turned away or priced out before they even start looking seriously. The ratio matters more than the raw price tag. Incomes have grown too, just nowhere near as fast as home prices climbed over the same stretch.
Mortgage Rates and What They Actually Cost You Monthly
Rates moved around a lot through 2025 and into this year. As of early August 2026, the 30-year fixed average sits around 6.7%. That’s per Freddie Mac’s weekly survey, up slightly from where it was a year ago. Not the crisis-level spike from 2022 and 2023. Nowhere close to the sub-4% rates a lot of current buyers still remember from a few years back either. Every half a point on a mortgage rate moves the monthly payment on a $300,000 loan by roughly $90 to $100. Doesn’t sound like much on paper. Adds up fast over a 30-year term though, and it’s exactly the kind of shift that pushes a household from “barely qualifies” to “doesn’t qualify” without their income changing at all.
What’s the average mortgage rate right now?
Around 6.7% for a 30-year fixed loan. That’s as of early August 2026, per Freddie Mac’s weekly rate survey, tracking close to what Bankrate and other lenders are quoting the same week. Rates have bounced within roughly half a point of that mark for most of 2026 so far. Worth checking a current lender quote directly before assuming any specific number. This moves week to week, sometimes day to day, depending on broader economic news.
Where Middle Class Homes Are Still Findable
Affordability isn’t uniform across the country, not even close. Parts of the Midwest and pockets of the Rust Belt still have inventory a household earning $60,000 to $75,000 can realistically afford, sometimes without stretching much at all. Coastal metros and much of the Northeast tell a very different story. Even upper-middle incomes struggle against local price levels there. My cousin ended up widening her search outside the metro she originally wanted. Found meaningfully more inventory in her actual range once she did. That’s not a fix everyone can make. Moving isn’t always an option. It’s still the single biggest lever a lot of middle-income buyers have available right now, whether they love the idea or not.
Which areas still have affordable homes for middle-income buyers?
Generally the Midwest, parts of the South, and specific Rust Belt metros. Home prices there haven’t climbed nearly as fast as incomes, relative to the coasts anyway. Local job markets and school districts still matter enormously within those regions though. “Affordable metro” doesn’t automatically mean every neighborhood inside it works for a given household. Checking metro-level price-to-income data before committing to a search area saves a lot of wasted time. National averages hide a lot of local variation.
Conclusion
Middle class homes haven’t disappeared. The income needed to buy one has just climbed faster than most paychecks kept up with. Nearly 5x median income now versus 3.2x through the 1990s. A $120,800 minimum income for the typical listing. A national affordable-inventory share cut roughly in half since 2019. None of that means giving up though. It means widening the search, checking real local numbers instead of national headlines, going in with a realistic budget instead of the one that would’ve worked a decade ago. My cousin found her place eventually. Took a wider map and a lot more patience than she expected going in, more than either of us thought it would.
Frequently Asked Questions (FAQ’s)
Home prices climbed roughly 53% since 2019 while median household income grew only about 24% over the same period, according to industry data compiled in Harvard’s 2026 housing report. That gap between price growth and income growth is the core driver, not any single factor like interest rates alone.
Harvard’s Joint Center for Housing Studies calculates roughly $120,800 as the minimum household income needed to afford the median-priced existing home, assuming a standard down payment and current mortgage rates. Only about 16% of renter households currently earn that much.
Forecasts from the Mortgage Bankers Association and Fannie Mae have pointed to the 30-year fixed rate staying in roughly the 6% to 6.5% range through the rest of 2026, rather than a sharp drop. Rates can shift with broader economic news though, so treat any forecast as a general direction rather than a guarantee.
Generally in the Midwest, parts of the South, and specific Rust Belt metro areas, where home prices haven’t outpaced local incomes as dramatically as they have on the coasts. Checking metro-specific price-to-income data is more useful than relying on national averages when narrowing down an actual search area.

1 thought on “Middle Class Homes: Why It Now Takes $120,800 to Buy the Median House”